Everything You Need To Get Started Using Pivot Points In Exness
The first thing many traders do when they open their forex charts is to add a pivot point indicator. But not many people understand what the indicator really is and how it works.
In this article, you’ll learn everything about pivot points and how they work. You’ll also see some of the advantages and disadvantages of the technical analysis tool when you use it in your chart. The knowledge you gain here will solidify your skills on how to trade pivot points.

What Are Pivot Points In Forex?

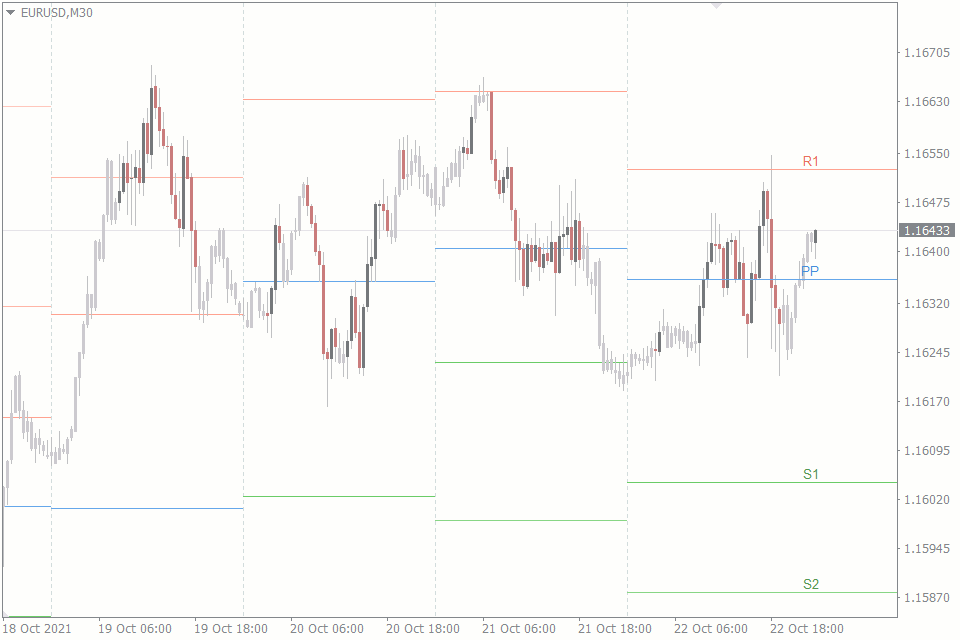
A pivot point indicator uses the price actions of yesterday to predict potential turning points on your chart today. It is defined by a line that extends throughout a trading day when you add the indicator to your chart.
The pivot point isn’t always alone on the chart. It is accompanied by support and resistance levels below and above it, respectively. And just like the pivot point itself, these support and resistance levels are also used to identify potential turning points on a currency pair.
Pivot points are most common among day traders because the drawn levels give them a sort of plan on how to trade the market on that day.
And unlike many other indicators that leave you to make personal interpretations as to what the price is doing, the signals of the pivot point indicator are straightforward. The market is bullish when the price is above the pivot point and bearish when the price is below the pivot point.
Calculating Pivot Points
Pivot points are originally calculated on daily charts. However, there are pivot point indicators that allow you to calculate pivot points on weekly and monthly charts.
For the sake of this article, we’ll be showing you how to calculate pivot levels on the daily chart. But the fundamentals of this calculation apply for the weekly and monthly charts.
Pivot points are calculated at the beginning of a trading day, and it is calculated as follows:
Basic Pivot Point (PP) = (High + Low + Close) / 3
Resistance 1 (R1) = (2 x PP) – Low
Support 1 (S1) = (2 x PP) – High
Resistance 2 (R2) = PP + (High – Low)
Support 2 (S2) = PP – (High – Low)
Resistance 3 (R3) = High + 2 (PP – Low)
Support 3 (S3) = Low – 2 (High – PP)
Note that:
- High refers to the highest price of the previous trading day
- Low refers to the lowest price of the previous trading day
- Close refers to the price of the previous trading day
Types of Pivot Points
The pivot point we’ve been talking about up to this point is the classic pivot point. It is its calculations we have up there, and it is the most common pivot point among traders. However, there are four more types of pivot points, and they are:
- Woodie
- Camarilla
- Fibonacci
- CPR
The other four pivot points are used in the same way as the classic pivot points, but their levels are calculated differently. In our article about the All-In-One pivot points indicator, we covered each of these pivot points, their strengths, weaknesses, and how each is calculated.
Advantages of Pivot Points
When you add pivot points to your forex chart, what are those things you expect to gain from it? The advantages of pivot point indicators in your forex trading include:
Determining the market sentiment
Many day traders rely on the pivot points for one reason: it helps them to determine the market sentiment. And with this knowledge, planning their trades becomes very easy. When price falls underneath the pivot point, they regard it as a bearish sentiment. The price rising to the upside of the pivot point, on the other hand, is seen as a bullish sentiment.
Help to plan trades

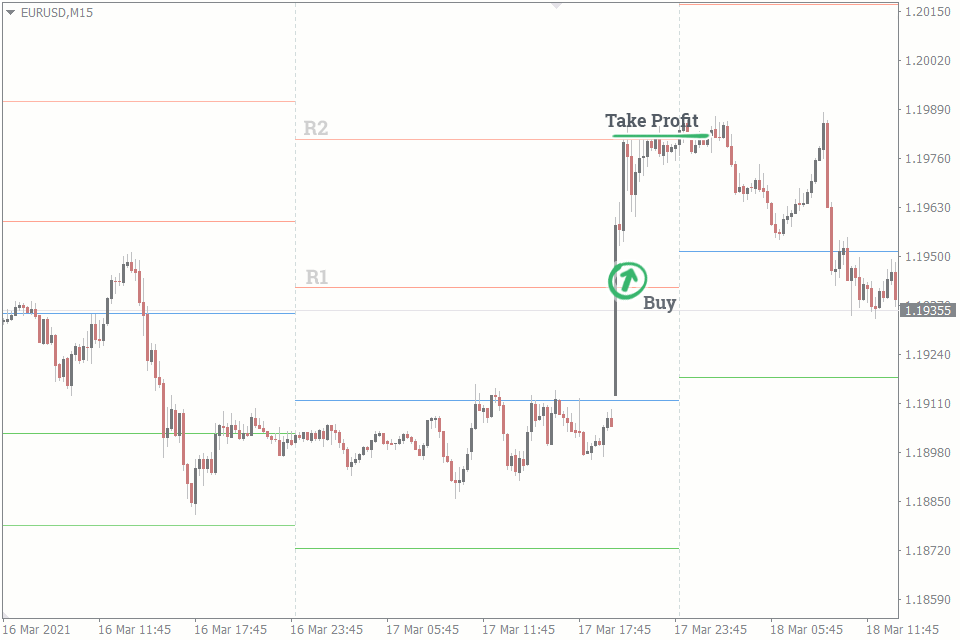
Pivot points offer traders an easy way to plan their trades. They know where their potential entry and exit points are. For instance, when the price climbs above the R1, day traders may enter a buy order at that point and take their profit on R2 or R3. Similarly, if the price crosses S1 to the downside, traders often enter sell trades and take their profits on S2 or S3.
Support and resistance levels
Pivot points are also useful as support and resistance levels. And you can trade them in the same way you can trade your normal support and resistance levels.
Disadvantages of Pivot Points
Now that you know the potential benefits of pivot point indicators, what are the potential downsides?
No assurance they’ll hold
Pivot points are purely based on calculations. They have no hold on the market, whatsoever. The reason pivot points have worked to this day is that they’re so popular and many traders expect reactions at these pivot levels. They then back their expectations with trades around the areas, forcing the price to react.
However, it is always not certain that the price would experience reactions when it reaches them. There are times when a price ignores a pivot level like it wasn’t there. Instead it forms reactions in the middle of the pivot point and the one next to it.
Limiting
In markets where the pivot points are failing to hold, the defiance of the expectation can often cripple inexperienced traders. They don’t know what to do, whether to buy, sell or wait.
And most of the time, they end up making the wrong decisions. However, one way to upset this limiting effect is to use pivot point indicators that offer the other types pivot points apart from the classic pivot points. This difference is often what sets the best pivot point indicators apart. An example of such an indicator is the All-In-One pivot points indicator.
Conclusion
Pivot points, when used properly, can be immensely helpful to the forex trader. But just like any other technical trading tool or indicator, you should not rely on the pivot points indicator singly. It is best to use it in confluence with other forex technical trading tools.

